テーマ:
chartの意味と使い方【図表・ランキング・海図】 (3 意味)
意味 1:図表 (chart)
chart
/tʃɑːrt/
n.
A picture that uses shapes and lines to show information, like numbers or how things change.
図表
➕
ずひょう
n.
情報を視覚的に示すために線や図形を用いた図。
📘 詳細と使い方
📖 語根解説
ラテン語の「紙」に由来し、情報を図示する意味に発展。
💡 記憶法
「チャート」は「地図」や「図表」のイメージ。「茶と」覚えるより、視覚情報を思い浮かべよう。
📖 例文
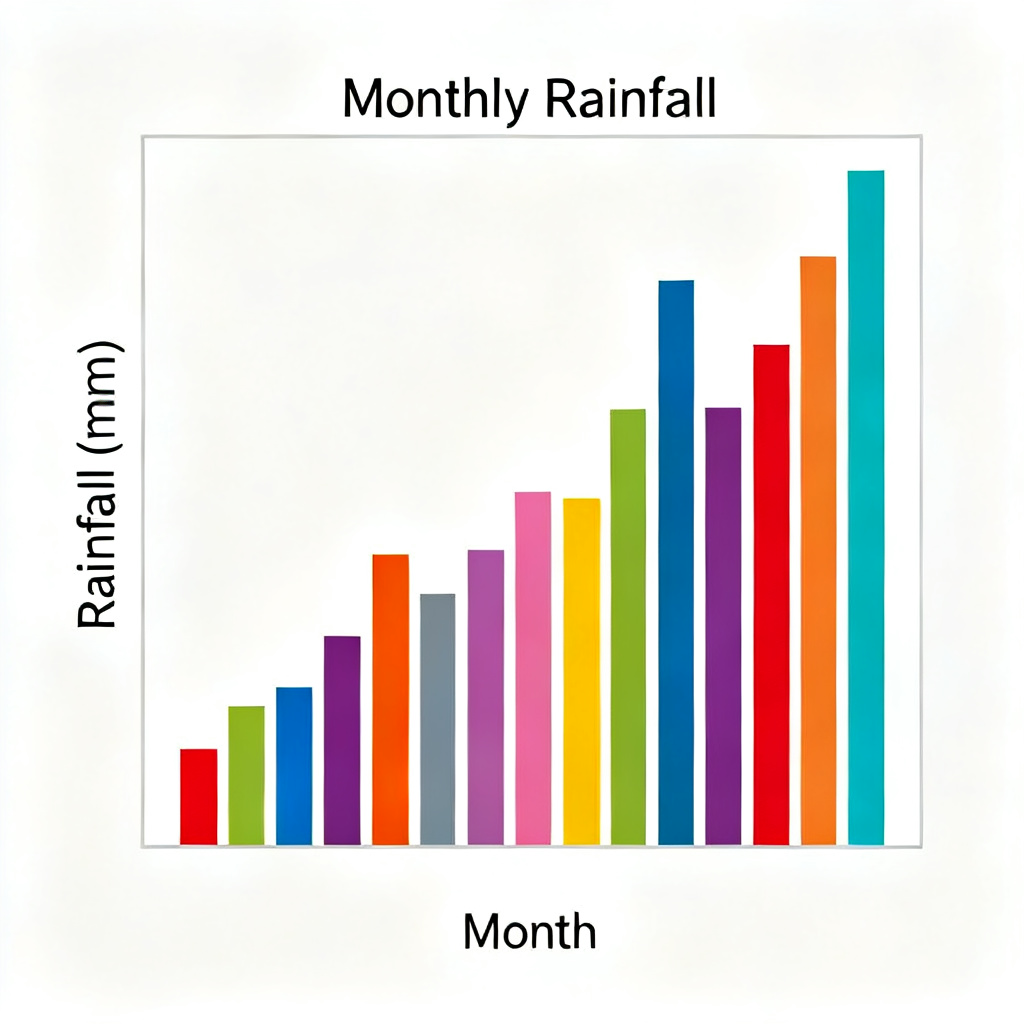
The teacher drew a colorful bar chart on the board to show how many students preferred each sport.
先生は黒板にカラフルな棒グラフを描き、それぞれのスポーツを好む生徒の人数を示した。
🔗 コロケーション
bar chart – 棒グラフ
pie chart – 円グラフ
flow chart – フローチャート
🌱 派生語
charting (名) – 図表化すること
📖 文化的背景
元々は羊皮紙やパピルスを指したが、中世に航海図として使われるようになった。現代ではグラフやランキング表も指す。
意味 2:ランキング (chart)
chart
/tʃɑːrt/
n.
A list that shows which songs, movies, etc., are the most popular at a certain time.
ランキング
➕
ランキング
n.
特定の期間に人気の高い曲や映画などを順位付けした一覧。
📘 詳細と使い方
📖 例文
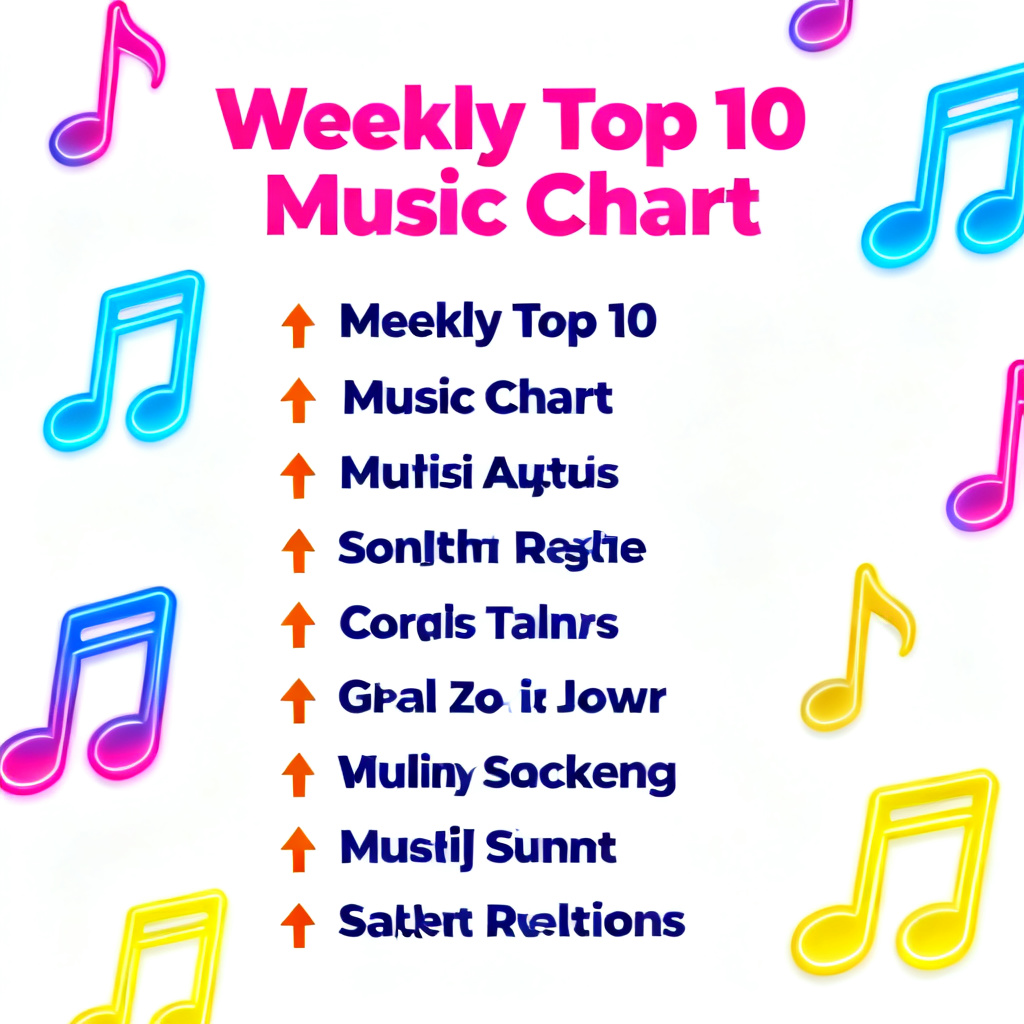
Her new single jumped to the top of the music charts within a week of its release.
彼女の新曲はリリースから1週間以内に音楽チャートのトップに躍り出た。
🔗 コロケーション
music chart – 音楽チャート
top chart – トップチャート
hit chart – ヒットチャート
🔄 類義語
ranking (名) – 順位表
🌱 派生語
chart-topper (名) – チャート1位の曲
意味 3:海図 (chart)
chart
/tʃɑːrt/
n.
A special map used by sailors for sailing on the sea, showing depths, coastlines, and dangers.
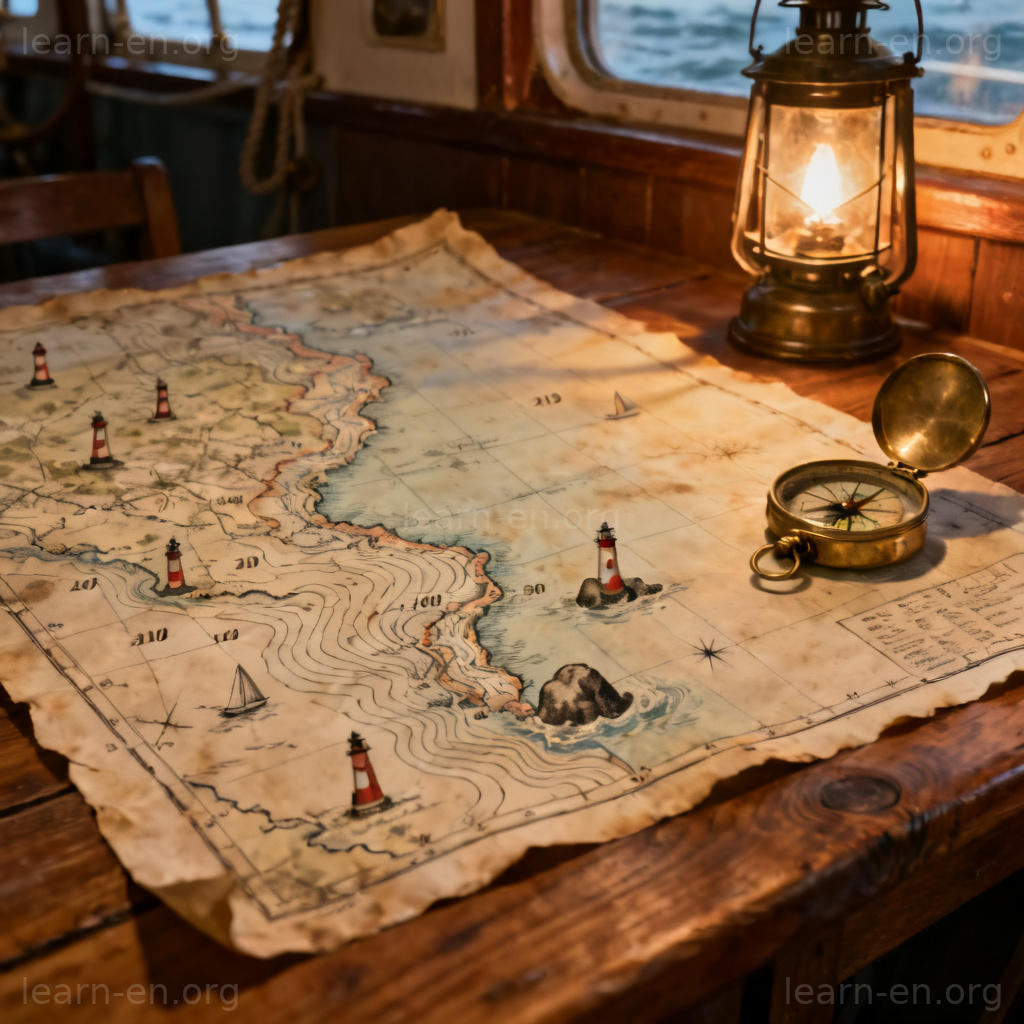
海図
➕
かいず
n.
航海のために水深や海岸線、危険箇所などを記した地図。
単語帳
データはこのブラウザに保存されています